Portfolio
AtliQ Grands
Power BI,Excel
Here, as a business intelligence analyst by Adventure Works,a fictional global manufacturing companythat produces cycling equipment
AtliQ Grands owns multiple five-star hotels across India. They have been in the hospitality industry for the past 20 years. Due
to strategic moves from other competitors and ineffective decision-making in management, AtliQ Grands are losing its market share
and revenue in the luxury/business hotels category. As a strategic move, the managing director of AtliQ Grands wanted to incorporate
“Business and Data Intelligence” to regain their market share and revenue. However, they do not have an in-house data analytics team
to provide them with these insights.
Task
To analyze AtliQ Grands’ performance over the past 3 months, identifying revenue trends and key factors. The goal is to provide
actionable insights for revenue management decisions so that it can regain its market share and revenue.
Data
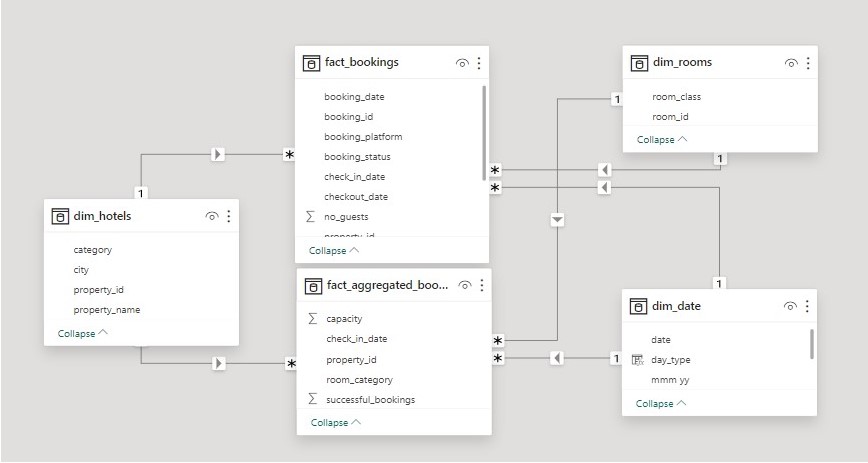
The dataset, from codebasics.io, consists of five CSV files. CSV files:
- dim_date
- dim_hotels
- dim_rooms
- fact_aggregated_bookings
- fact_bookings
Data Model
Key Measures
ADR : Average Daily rate It is the ratio of revenue to the total rooms booked/sold.It is the measure of the average paid for rooms
sold in a given time period
Realisation % : It is nothing but the succesful "checked out" percentage over all bookings happened.
RevPAR % : Revenue Per Available Room RevPAR represents the revenue generated per available room, whether or not they
are occupied. RevPAR helps hotels measure their revenue generating performance to accurately price rooms. RevPAR can help hotels
measure themselves against other properties or brands.
DBRN : Daily Booked Room Nights This metrics tells on average how many rooms are booked for a day considering a time period
DSRN : Daily Sellable Room Nights This metrics tells on average how many rooms are ready to sell for a day
considering a time period
DURN : Daily Utilized Room Nights This metric tells on average how many rooms are succesfully utilized by customers for a day
considering a time period
Week-on-Week (WoW) is a type of business metric that measures changes in a specific variable over a period of one week compared
to the previous week. It is a common way of tracking business performance over time and is particularly useful for analyzing trends
and identifying areas where improvements can be made.
Here are the metrics for which, the WoW change% is created:
- Revenue WoW change % : To get the revenue change percentage week over week.
- Occupancy WoW change % : To get the occupancy change percentage week over week.
- ADR WoW change % : To get the ADR (Average Daily rate) change percentage week over week.
- RevPAR WoW change % : To get the RevPAR (Revenue Per Available Room) change percentage week over week.
- Realisation WoW change % : To get the Realisation change percentage week over week.
- DSRN WoW change % : To get the DSRN (Daily Sellable Room Nights) change percentage week over week.
Dashboard
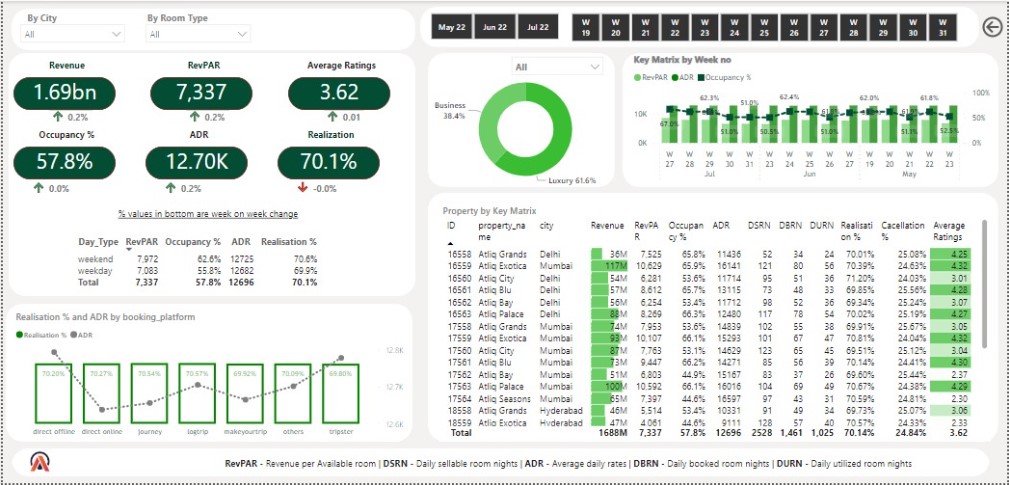
Dashboard consists of KPIS :Revenue,RevPAR,Avg Ratings,Occupancy,ADR,Realization.
insights
- City that generated most revenue is Mumbai(6660.64M) and Delhi the least(290.92M).
- Even though Delhi generates less revenue one of the properties Atliq Palace comes fourth
in total revenue generation. - Regarding rating Delhi has the highest.
- Amoung Category Luxury created more revenue.
- Weekend occupancy rate is higher compared to weekdays.
- There is only slight schange in Realisation %.
- logtrip,journey,makeyour trip are top booking platforms.
- Revenue generated by Elite and premium together is nearly double the revenue generated
by Presidential and standard.
Recommendations
- ADR for the rooms ,can be changed to dynamic so that we can have maximum revenue generations.
- Even the Weekend and Weekday Price we can change the pricing, that is for friday and saturday
we can increase the pricing charged per room. - Occupancy and ratings of four hotels are below 50 and 3 respectively.There Service need to be
checked and need to find why they are performing less. - There offline channels can provide free additional discounts or complimentary night stay etc.
- One of the hotels in delhi is performing really great compared to others in Delhi.So we can do
an analysis as to what is making it more popular,so that we can implement it on the other
hotels as well. - Ratings should be considered as one the main factors since nowadays no one does anything
without looking at them.