Portfolio
AirBnB Listing Analysis
Python(Pandas,Seaborn,Matplotlib)
Analyze AirBnB listings in Paris to determine the impact of regulations
Scenario
As Professional analyst for AirBnB, a platform that allows individuals to rent out thoer homes for travellers.As AirBnB has grown
popularity,it has increasingly become the focus of regulations designed to limit the number of regulations designed to limit the
number of properties listed in city.
Problem
The dataset, from codebasics.io, consists of five CSV files. CSV files:We need to analyze Paris listings, with a focus on pricing.
Leadership wants a visual summary of factors affecting pricing and whether the regulations adopted in 2015 impacted listings in
the Paris market.
we need to
- Explore and profile the data to correct any quality issues
- Prepare and reformat the data for visualizations.
- Visualize the data and identify key insights and recomendations.
The Data Set
AirBnB listings and Reviews From Maven
- Csv Files
- 36 fields
- 5652855 records
Work done
Using Jupyter Libraries Used: Pandas,Matplotlib,Seaborn,Plotly
insights
The following are the insights:
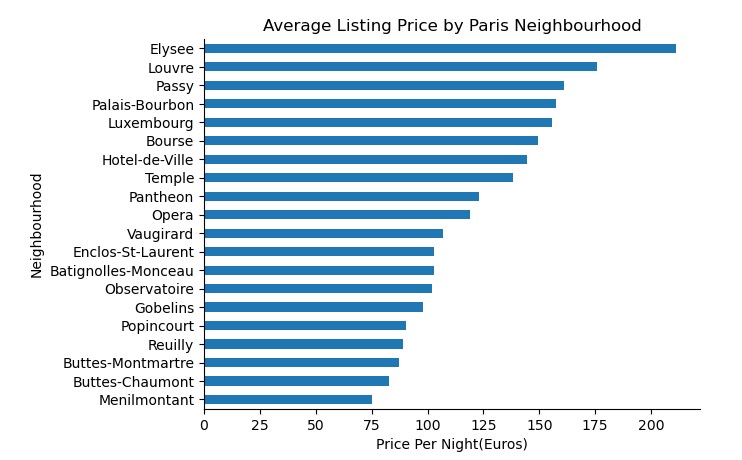
From the above where nighbourhood has been grouped to find the most expensive one,we will get to know
- Elysee as the most expensive neighbourhood followed by Louvre.
- Least expensive was Montmartre and Buttes-Chaumont.
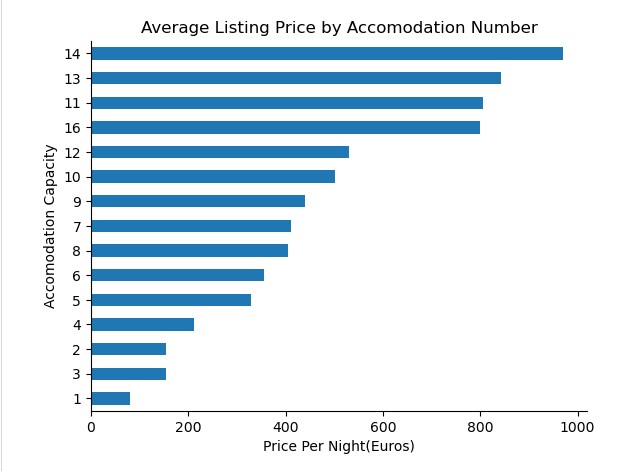
To compare between accommodation number to the average listing price
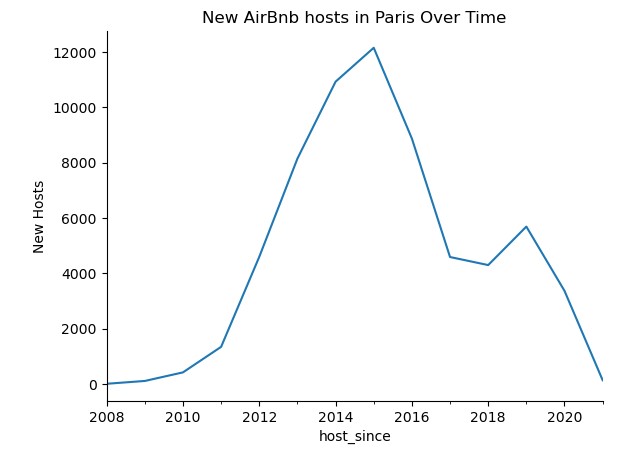
No of new hosts in paris over time. We can see a decrease in the number after the 2015
regulations. Eventhough it still did go up a bit in 2019 it went down during the covid lockdown.
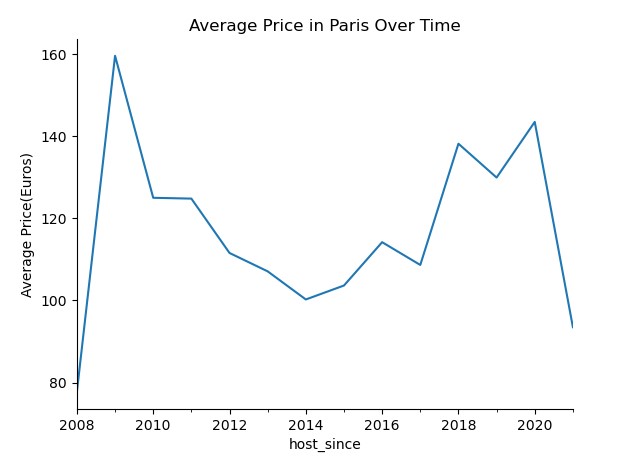
When we see this graph we can understand that after the regulation the price listing has gone up.
There is slight difference that is up and down along the way.
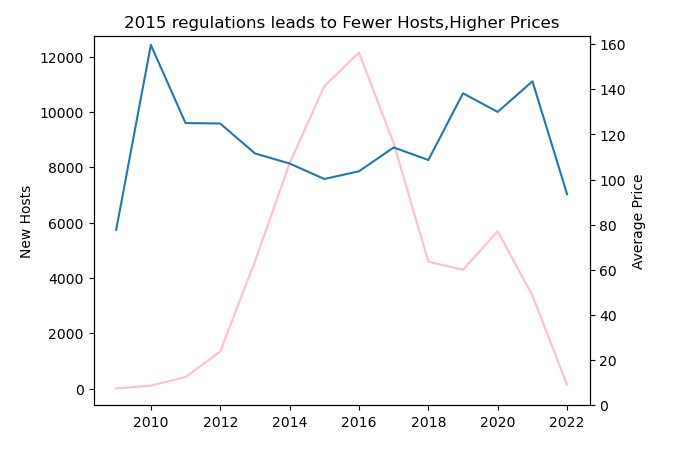
Here we are comparing the new hosts and avg price listing.As the ttile itself we can say that there
is decrease in new hosts after 2015 and the avge listing price has gone up during that period.
But moving towards 2019-20 the new hosts as well as the price goes decreasing.
Github