Portfolio
Adventure Works
Power BI
Here, as a business intelligence analyst by Adventure Works,a fictional global manufacturing companythat produces cycling equipment
and accessories. The Management team needs to track KPIs (sales, revenue, profit, returns), compare regional performance, analyze
product-level trends, and identify high-value customers. We have Raw .csv files which contain returns, transactions, products, customers,
and sales territories.
Ask Phase
What are we trying to solve here?
- Connect and transform the raw data.
- Build a relationship.
- Create calculated columns and measures with DAX.
- Design an Interactive Dashboard to visualize the data.
Prepare Phase
I have collected data from 11 .csv files, which includes data for customers products, return data, sales data from 2020 to 2022,
Territories and product category as well. These fies were loaded to PowerBi for further analysis as required.
Process Phase
In this phase, we have checked data quality, and key profiling techniques like column distribution, and removed empty values, errors,
and outliers. We have transformed tables using conditional columns, date/time tools, combining and modifying queries. We have created
the date and territory hierarchies. We have created calculated columns and measures for better understanding. Nested functions etc where
used to find different customer with income categories etc
Analyze and Share Phase
Interactive Dashboard KPIs has been created to give an overall Idea of what is happening.

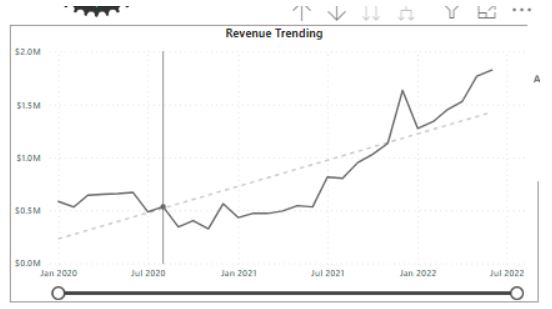
Revenue graph has been displayed to show monthly, qaurterly and yearly sales of product.
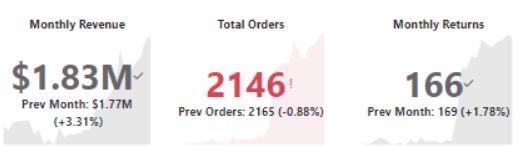
Cards have been displayed to show monthly revenue, total orders and total returns of that particular month.
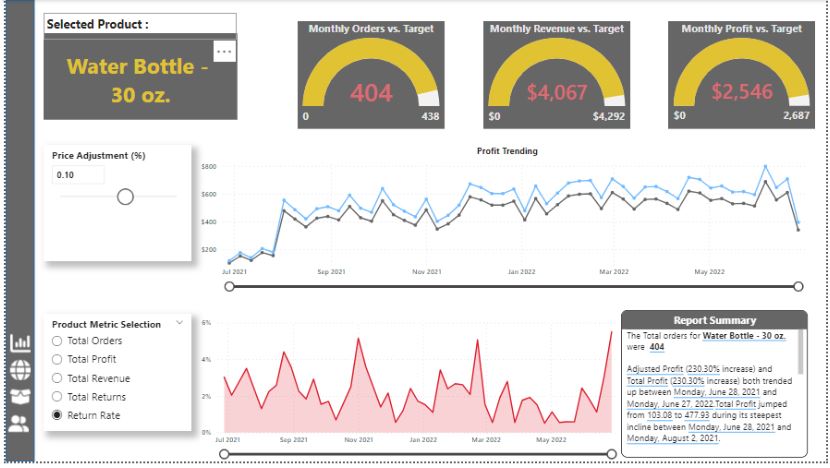
Geographical map has been shown to find the regions where the product was sold. A page has been created to get details of each
product such as its monthly revenue, monthly profits, monthly returns, a graph to show its profit trending created with date
hierarchy and where we can adjuct price and check the profit has also been done.smart narrative has also been added.
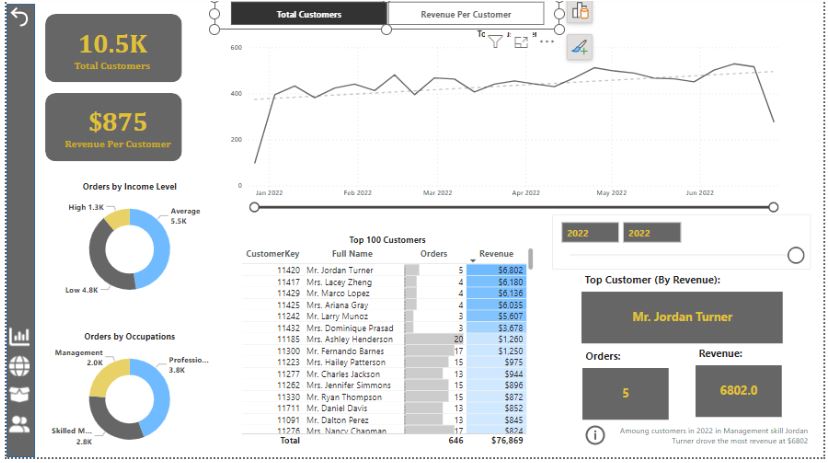
For customer details page we have divided cutomers on the basis of income and occupation using donut chart. A table to show top
customers has been given.A chart for reveneue per customer and total customers is also given.
Bookmarks has been used to change to original page phase after filtring. Drill through has been used to find details
of ech product.
Act Phase
Share the report with necessary people and ask for feedbacks or any other details that need to be added.
Github